Check out the latest updates below.
The latest enhancement to Maintenance Groups includes the ability to apply a one-time service interval for break-in maintenance. This can include items required as a one-time occurrence for newer equipment to break it in, such as oil change, brake check, and changing hydraulic fluid or general inspection items. Setting this up beforehand ensures that the equipment will receive it's proper care to follow manufacturer guidelines, often required for warranty claims.
When creating a new Service Interval, for one-time service, select Do not repeat from the new Recurrence field. Once the asset meets the one-time-service threshold, the system will auto-generate a Work Order, or the user can generate the WO early.
T3 Maintenance Group

Asset Service Overview

Link Mobile App

For more information, see Setting up a Service Interval for Preventative Maintenance.
An update to the T3 Dash Cam experience introduces a new Health Status table, now available on the T3 Camera page. This update gives T3 Dash Cam customers a comprehensive view of all dash cams in their fleet. It improves visibility into device performance and helps identify cameras that may require inspection or maintenance.

Expand the row to see Event Type and Timestamp of when it occurred, providing more details as to why a camera may be unhealthy.

Navigate to the T3 Camera page and select the Dash Cam tab. This tab allows you to:

If a camera is flagged as Needs Attention or No Check-In, users are encouraged to contact support for assistance or review the Troubleshooting T3 Dash Cam Connectivity Issues article.
The latest update to T3 now provides OEM service manuals for troubleshooting and completing service-related tickets. Access and download the manuals directly from each Work Order or from the Asset's Service tab. The manuals are specific to the make and model of the assigned asset to ensure the most relevant information is provided.
Note: Service manuals may not be available for all equipment.
T3 Service page
Select the new Manuals tab from a Work Order in the T3 Fleet web app. Select the manual to view the PDF in a new tab or select the down arrow to download to a device.

When opening and downloading larger OEM manuals, a message will be displayed notifying the user that the system is retrieving the file, which may take a few moments.

T3 Asset Service tab
Select the Details button in the Asset Card on the T3 Map, then select the Service tab. The new OEM Manuals will be available in the Manuals section.

For accessing manuals on-the-go, see Access OEM Service Manuals Directly from Link Mobile App.
T3 now supports batch off-renting, allowing rental customers to off-rent multiple items in a single action. This enhancement is designed to streamline the off-rent process, especially for customers managing multiple assets across job sites or projects. Once the items are off-rented together, it will consolidate into a single invoice. This enhancement reduces the need for repetitive manual actions and simplifies the workflow.
Watch the video to see a quick walkthrough.
From the T3 Rentals Page
Customers can select the Actions ellipsis and then Off rent from the individual rental.

A new Batch Off-Rent window will display with the option to select other rentals to include in the off-rent action. If applicable, users can select how many quantity to partially off-rent the order.

Select when to off-rent the items, whether Now or Schedule. If scheduling, indicate the date from the calendar picker. Once done, select Off-Rent All Selected Rentals.

From the T3 Fleet Page (Individual Rental View)
Multiple items can also be off-rented from within an individual rental record by selecting the Rental Details tab from the individual Asset Details page.

The T3 Telematics Health Report provides visibility into T3 tracker health statuses. Updates to this report reflect clearer and more accurate health statuses and recommended actions to improve tracker health.
Important: The legacy Telematics Health Report 2.0 will be retired from T3 Analytics on Friday, July 25, 2025. Please note that existing scheduled reports cannot be carried over. To continue receiving updates, be sure to create and schedule a new Telematics Health Report before that date.

Healthy Trackers: This indicates the tracker device is in a healthy state. Some of the various statuses in a healthy state can be:
Needs Asset Attention Trackers: This status means the asset's tracker device needs to be reviewed. The report will indicate the reason why for further troubleshooting:
The T3 Assets page is redesigned to deliver a smoother, faster, and more intuitive experience, especially for users managing large fleets. Here's what's new:


This update reduces friction for users managing assets and lays the foundation for future enhancements.
With the recent improvements to Service Interval functionality, users can now define combination rules (e.g., miles and operational hours). To support this, the T3 system has been updated to visually highlight these thresholds, making it easy to recognize combination intervals at a glance.
This enhancement helps service managers and technicians quickly identify when an asset is approaching service from a combination rule.
Asset Details > Service
.png)
Upcoming Service table

Work Order Details

Asset Card on T3 Map

For more information, see Setting Up a Service Group Interval for Preventative Maintenance.
The EquipmentShare website now offers a streamlined credit application process, making it easier for customers to apply for a credit account when it is most convenient. The new self-serve form eliminates extra steps and paperwork, allowing customers to quickly submit their application online. Once completed, the form is routed directly to the EquipmentShare credit team for prompt handling. This improvement helps customers get approved quickly to complete their rental order.
Only an Owner and Manager-level role can submit a credit application.
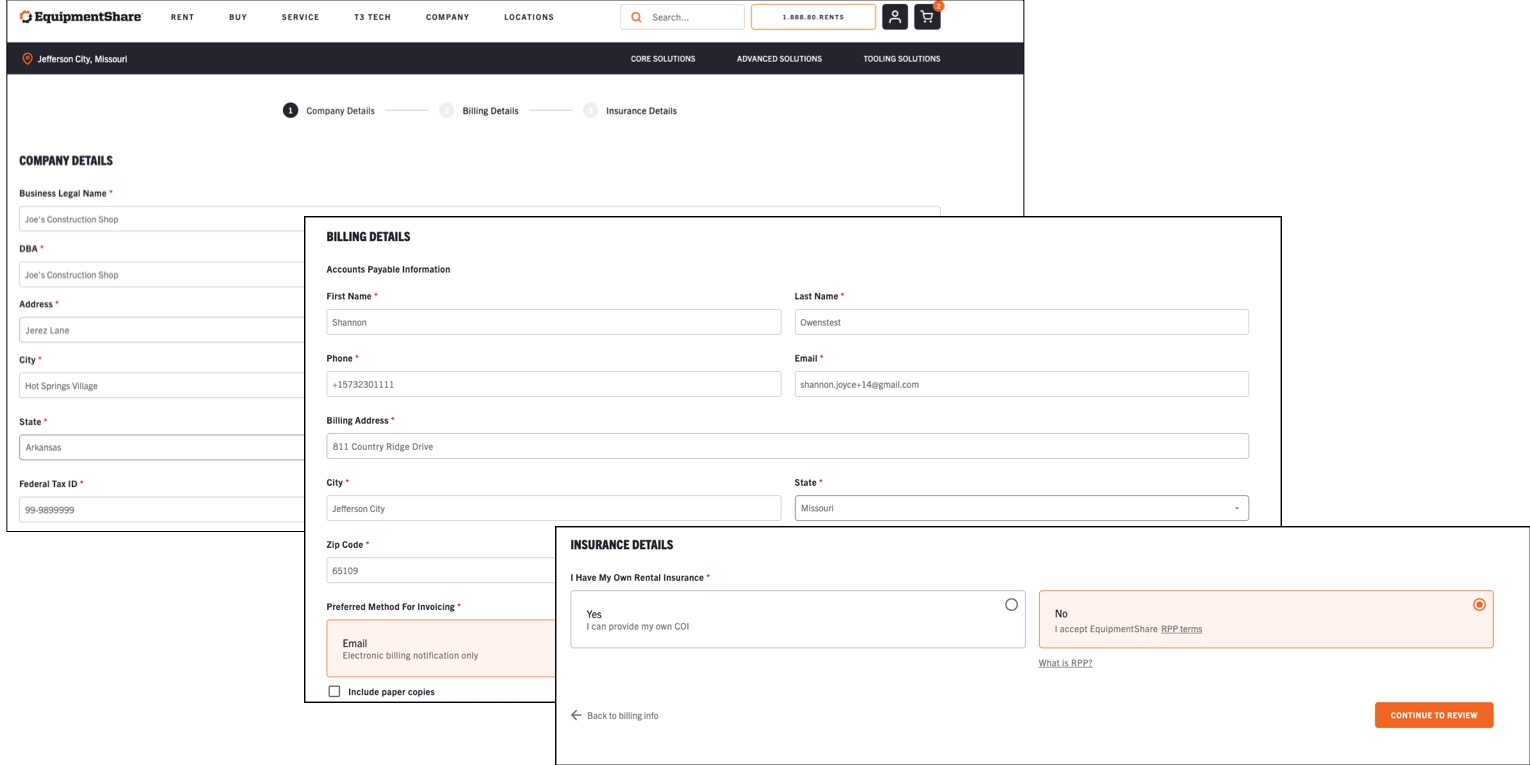
From Account Details on the EquipmentShare website, select Apply & Manage Credit Account. 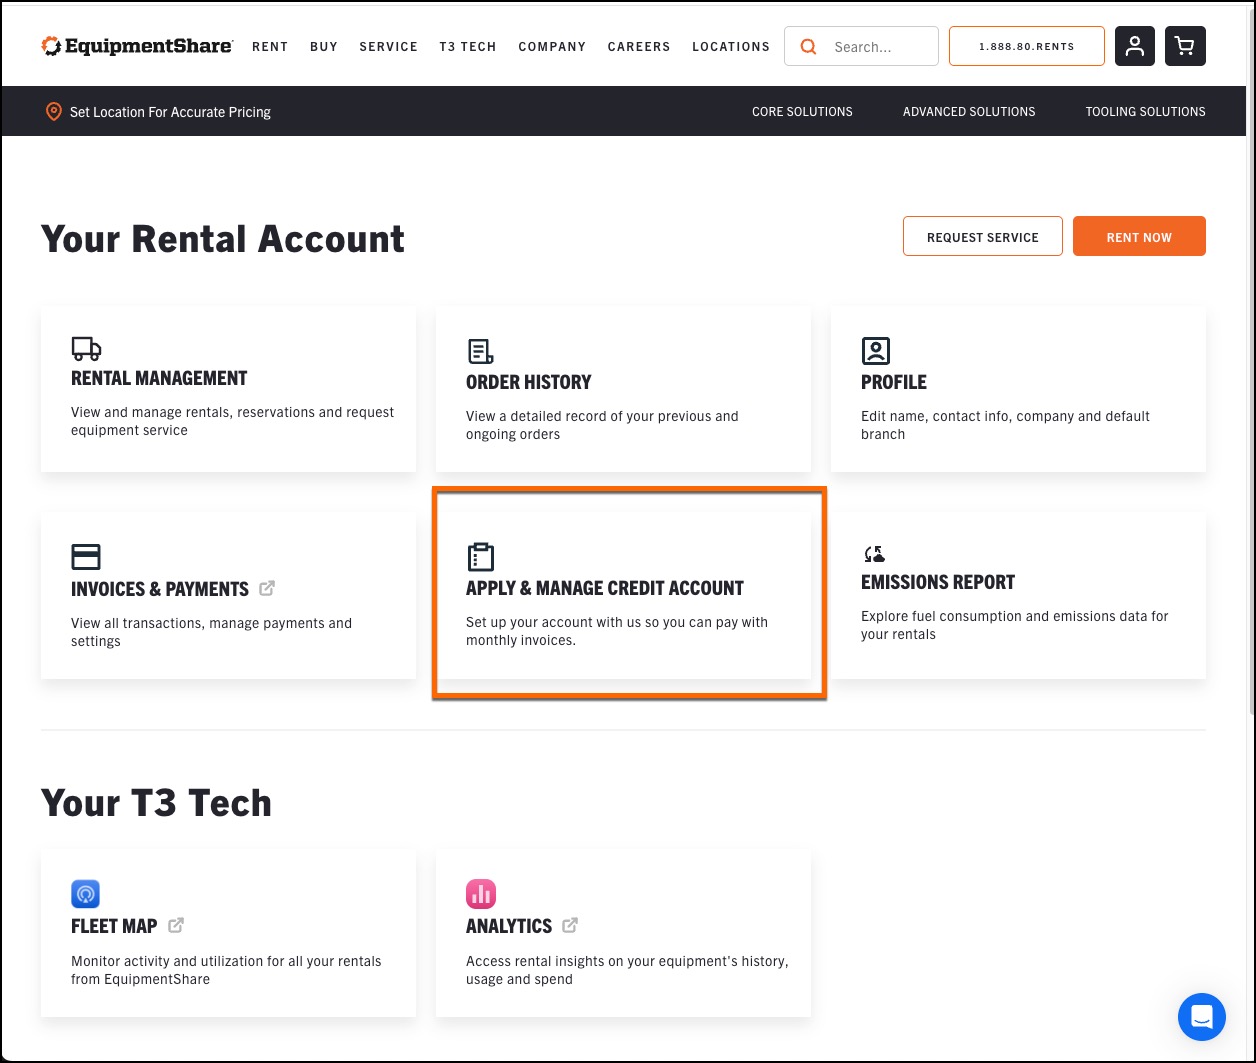
Before submitting the application, enter the Company, Billing, and Insurance information from the new form. The EquipmentShare credit team will review and process the request promptly.
The T3 asset creation and edit workflows have been updated to streamline data entry and improve asset identification for vehicles and trailers. These enhancements support more accurate fleet records and processes such as maintenance tracking and warranty claims.
The new enhancements include:


A new Time Tracking feature in the Link mobile app allows users to access the associated Work Order and asset directly from their clocked-in time card. This eliminates the need to navigate away from the time card to log time against a specific asset or Work Order.
To take advantage of this time-saving enhancement, update to the latest version of the Link mobile app and access it right from the clocked-in screen.
Quick asset access
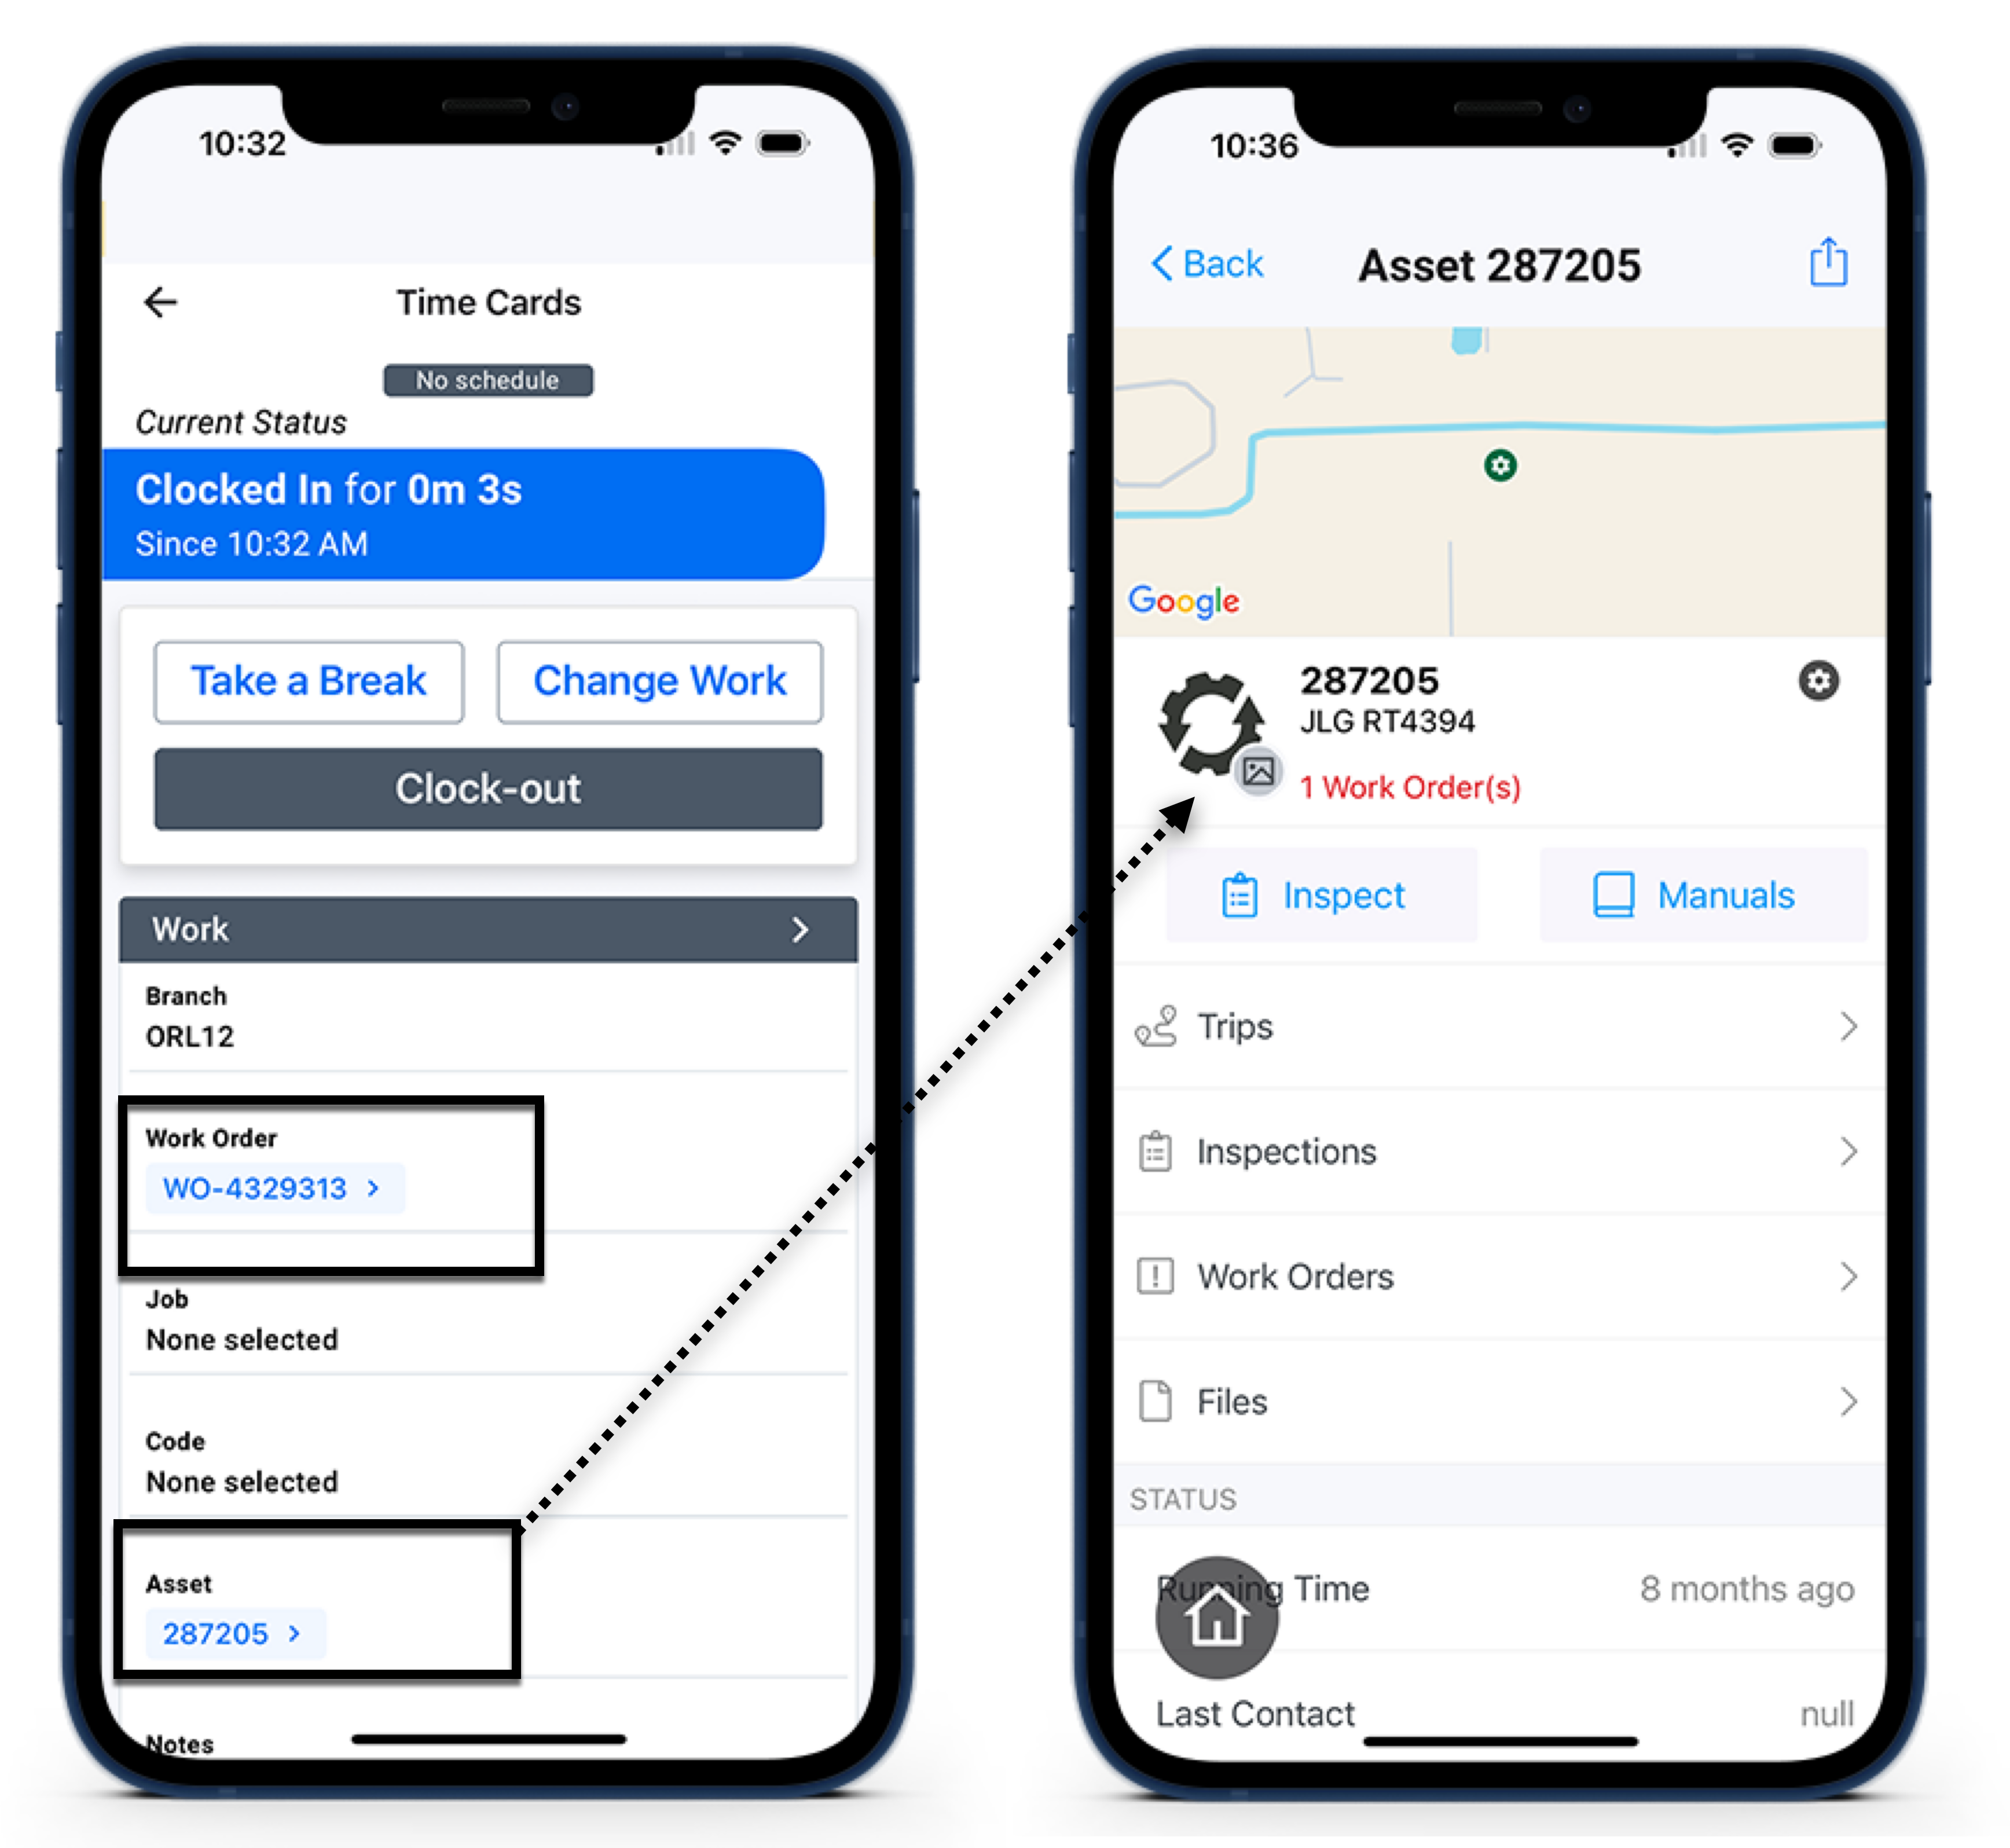
Quick work order access

To update to the latest version, see Updating Link Mobile App.


